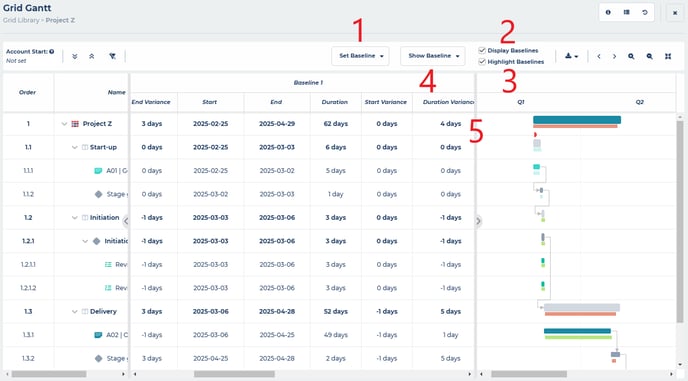
- Set baseline = sets baselines one through to three.
- Display baselines = toggles the display of your baselines in the Gantt chart on and off.
- Highlight baselines = toggles the colour of your baseline items to either grey i.e. no colour coding or colour coded as follows:
- Red = behind schedule
- Green = ahead of schedule
- Blue = on schedule
- Show baseline = when display baselines is toggled on, you can choose which baseline to show in the Gantt chart; any combination of one, two or three.
- Your baselines are shown in the Gantt chart and in the data table as baseline one, two and three, each with the following data columns:
- Start = the start date of the item at the point you set the baseline
- End = the end date of the item at the point you set the baseline
- Duration = the duration of the item at the point you set the baseline
- Start variance = the plus or minus difference between the start date of the item now and the point at which the baseline was set
- End Variance = the plus or minus difference between the end date of the item now and the point at which the baseline was set
- Duration variance = the plus or minus difference between the duration of the item now and the point at which the baseline was set
Note: you can choose to show/hide columns in the Gantt by right clicking on any column heading, selecting columns and then selecting which columns to show/hide. You can also re-order the columns by clicking and dragging as required. Once you have configured this to your liking, the Gantt will remember this so that the next time you open the Gantt in this grid, it will look the same.
Note: members with edit access to your grid can set and edit baselines, members with view access can only view baselines.