To set your favourite dashboard, click the star icon when viewing the dashboard and that dashboard will be set as your default dashboard (this will be the first dashboard you see when opening your dashboards).
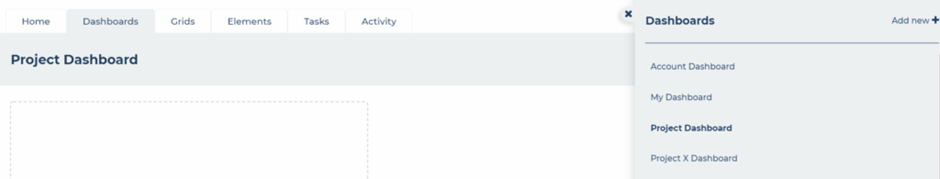
You have a personal list of dashboards which shows all the dashboards to which you have access.
To edit your list, hover your mouse over (or touch once on touch devices) the required dashboard and you can then:
- Change the name of the dashboard (if you have edit access)
- Move the dashboard to re-order it within your list by clicking and dragging the move icon
- Clone the dashboard (if you have edit access)
- Share a link to the dashboard
- Delete the dashboard (if you have edit access)
You can also click the share icon when viewing a dashboard, to copy a link to that dashboard and send it to your team members.
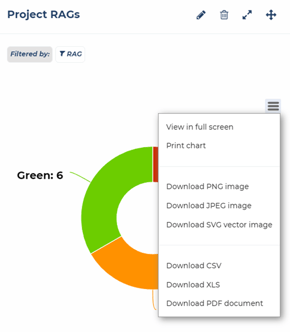
You can view larger versions of each chart by clicking the expand button on each chart widget. Each chart also has a set of tools which includes:
- Printing
- Download as PDF
- Download as an image (png, jpg or svg)
- Export the chart data (csv or xlsx)
To change the date range your time based charts are showing, you can select from pre-configured date ranges or set your own custom date range. Note that the date range will ONLY apply to charts that have a timescale.